Oct 26, 2026
Calibration Transfer in Spectroscopy: Why Models Break When Instruments Change
Why a calibration built on one spectrometer fails on the next, what each transfer method corrects...
A spectroscopic property model is validated when its predictions agree with your reference method, on samples it has never seen, within limits you agreed before the test. This guide explains what that means in practice for NMR property models in crude oil and fuel labs: which ASTM practices frame the work, how to design the validation set and the acceptance criteria, and a worked example that shows why an average can hide the failure that matters.
Last reviewed: 2 November 2026.
Two things can happen when a lab reports a property. A reference method measures it: an X-ray fluorescence analyzer for sulfur, a titration for total acid number (TAN), a digital density meter for API gravity. Or a spectroscopic model predicts it: it reads a spectrum and returns the value the reference method would most likely have given. The prediction is useful only if the lab can show, with numbers, how close it comes to the measurement.
Validation is therefore a comparison between two methods, with the reference method as the judge. Three conditions make the comparison meaningful:
The reference method has its own error. Repeatability (r) describes how close two results from the same operator and apparatus are expected to be. Reproducibility (R) describes agreement between laboratories. Both come from the precision statement of the method. If a model’s prediction error is already comparable to the reference method’s own scatter, no validation set can show the model is better, because part of every difference comes from the reference result. Our comparison of lab testing, NIR and high-field NMR makes the same point: compare prediction error with the published reproducibility of the primary test method.
Two consequences follow. A single accuracy figure across several properties tells a lab very little; each property needs its own statement. And a useful statement names the property, the range, the number of samples, the metric and the reference method.
Petroleum labs already have a body of practice for validating multivariate analyzers. It was written for infrared and Raman instruments, but the questions it asks are the ones any property model has to answer.
| Practice | Question it answers | Scope note |
|---|---|---|
| ASTM E1655 | How to build and check a multivariate calibration | Near- and mid-infrared |
| ASTM D6122 | Do the analyzer’s predictions agree with the primary test method? | Infrared and Raman analyzers for liquid petroleum products and fuels; notes it may apply to other multivariate analyzers |
| ASTM D8340 | Is the analyzer qualified to report a predicted primary test method result? | Infrared and Raman; each property qualified on its own |
| ASTM D6708 | How well do two methods agree, and does a bias correction improve it? | Two test methods that claim to measure the same property |
| ASTM D6299 | Is the measurement system still stable and in control? | Quality control charts for analytical measurement systems |
| ASTM D3764 | Does a process stream analyzer agree with the primary test method? | Online process analyzers |
D6122 distinguishes two situations. In local validation, used when only a limited number of validation samples is available, each prediction carries its own uncertainty, computed from the calibration statistics and from how far the sample sits from the centre of the calibration (its leverage). A binomial rule then sets how many results must fall within that uncertainty. In general validation, with enough samples over a range comparable to the calibration set, agreement is assessed with the statistics of D6708, including whether a bias correction improves it.
D8340 adds two points worth borrowing. Outlier detection must confirm that the model applies to each sample, including samples that fall in gaps of the calibration space. And when one spectrum predicts several properties, each property is qualified separately.
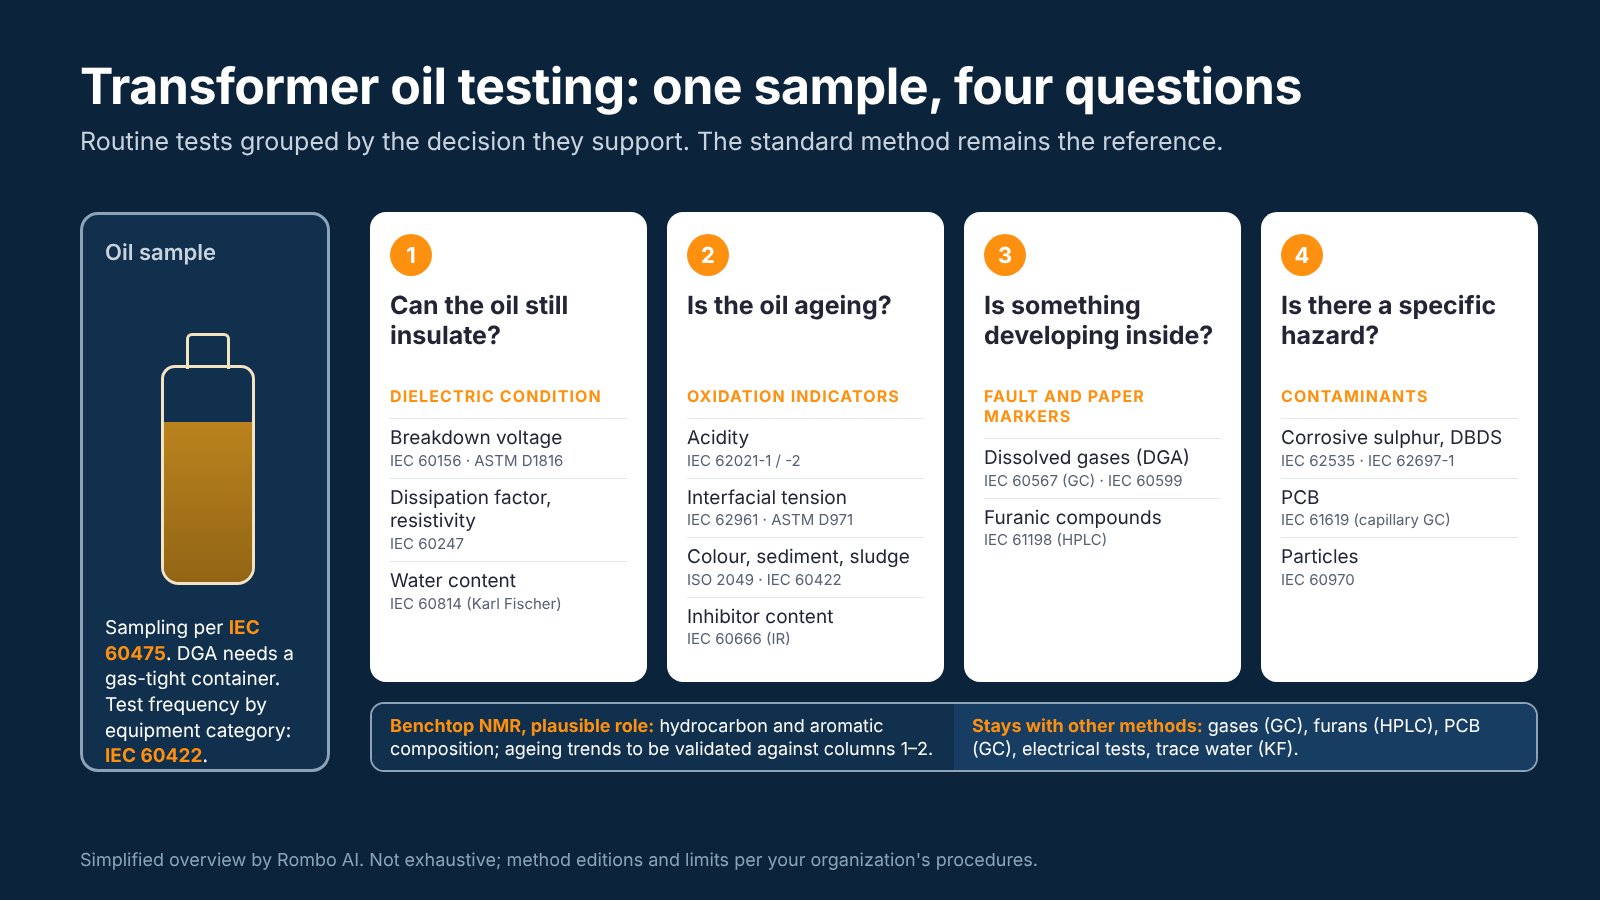
None of these practices names NMR. That is not a reason to invent a new standard of proof. It is a reason to borrow the logic openly and to write it into the validation plan: which practice is followed, which steps are adapted, and why. Labs that report transformer oil results against IEC methods can use the same structure; our transformer oil testing guide lists the methods involved.
A validation plan fits on two pages. Writing it before the first measurement protects both sides: the lab knows what it is signing off, and the supplier cannot choose the metric after seeing the results.
| Decision | What to fix in advance | Why it matters |
|---|---|---|
| Properties and methods | Each property, its reference method and version, and the lab that runs it | Every property is validated on its own |
| Sample set | Number of independent samples, range, crude families or grades, and how samples are chosen | The set defines where the validation holds |
| Reference results | Who runs them, duplicates where precision is in doubt, time between scan and reference test | Reference error and sample ageing enter every difference |
| Acceptance criteria | Limits for bias and for individual differences, tied to the reference method’s precision, and the minimum number of passing results | Fixed before the data, not after |
| Applicability | The rule that flags a spectrum as outside the model’s domain, and what happens to those samples | A model should say when it does not know |
| Sub-ranges | The bands or families checked on their own, with a minimum count in each | Averages hide local bias |
| Outcome | What a pass, a partial pass and a fail lead to | Decided before anyone is invested in the result |
How many samples? There is no universal number. It depends on the range, the diversity of the samples and how tight the limits are. Two practical points help.
First, the count limits what the validation can tell you. With 40 samples and a rule of “at least 36 within limits”, a model whose true pass rate is 95% passes 95% of the time. A model whose true pass rate is only 90% still passes 63% of the time, by the same binomial calculation. A small set cannot reliably separate a good model from a mediocre one, so the limits and the count have to be chosen together.
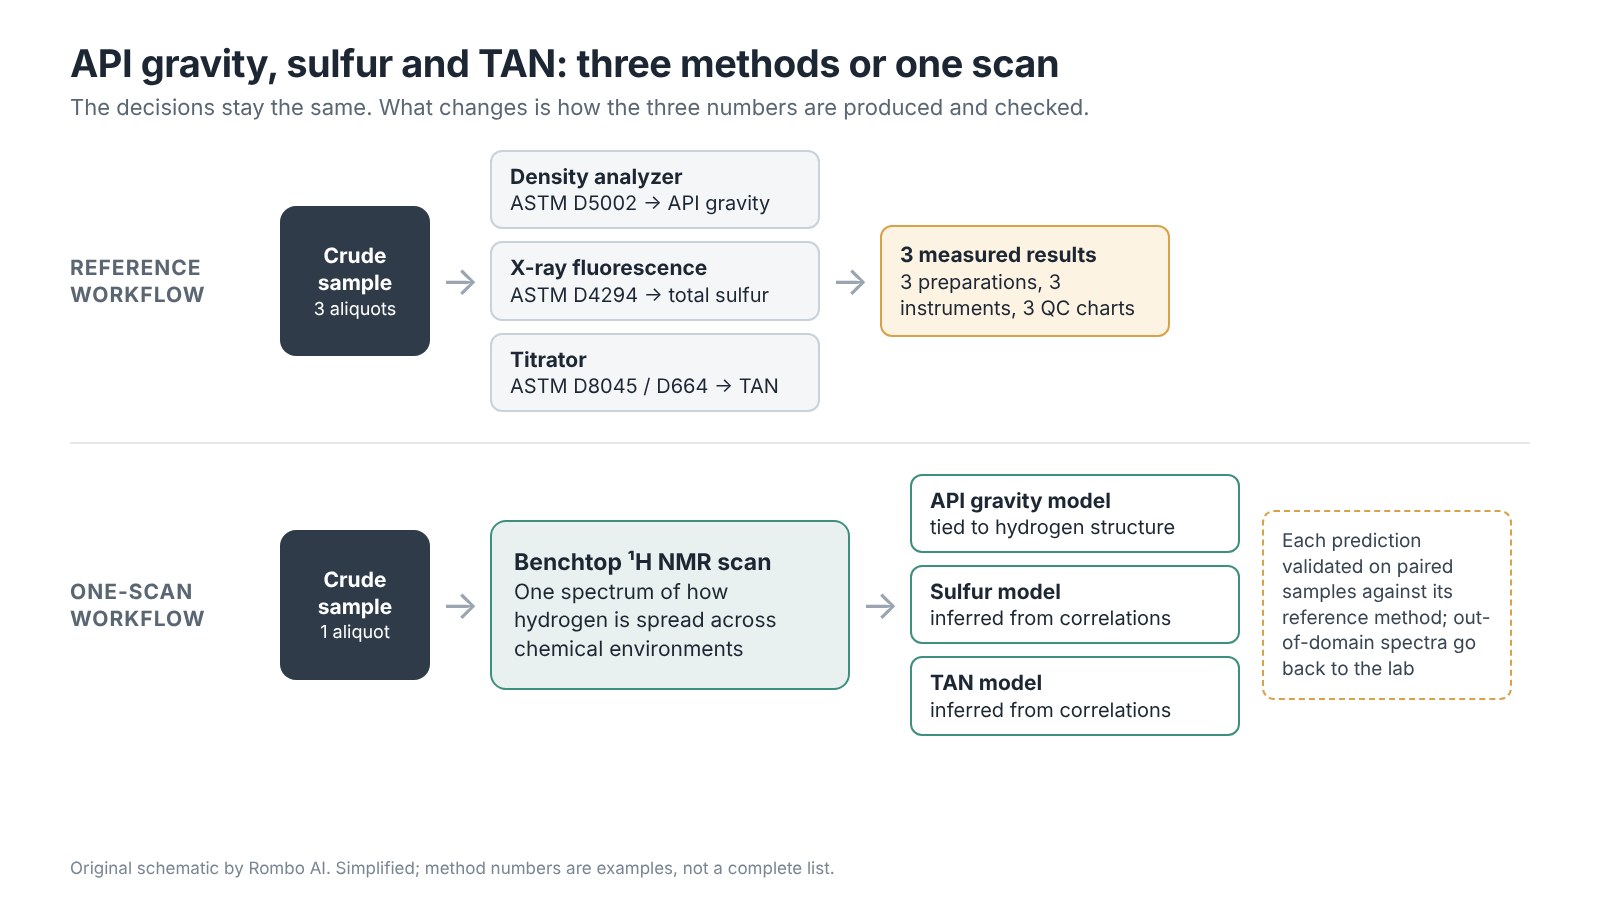
Second, every sub-range you want to claim needs samples of its own. Our note on API gravity, sulfur and TAN in one workflow explains why properties inferred from correlated spectral features, such as sulfur and acidity, depend more on how well the calibration covers your crude slate. Those are the properties where a thin corner of the range is most likely to fail.
The example uses synthetic data generated to show the mechanism. It is not an experimental result and does not describe a Rombo model.
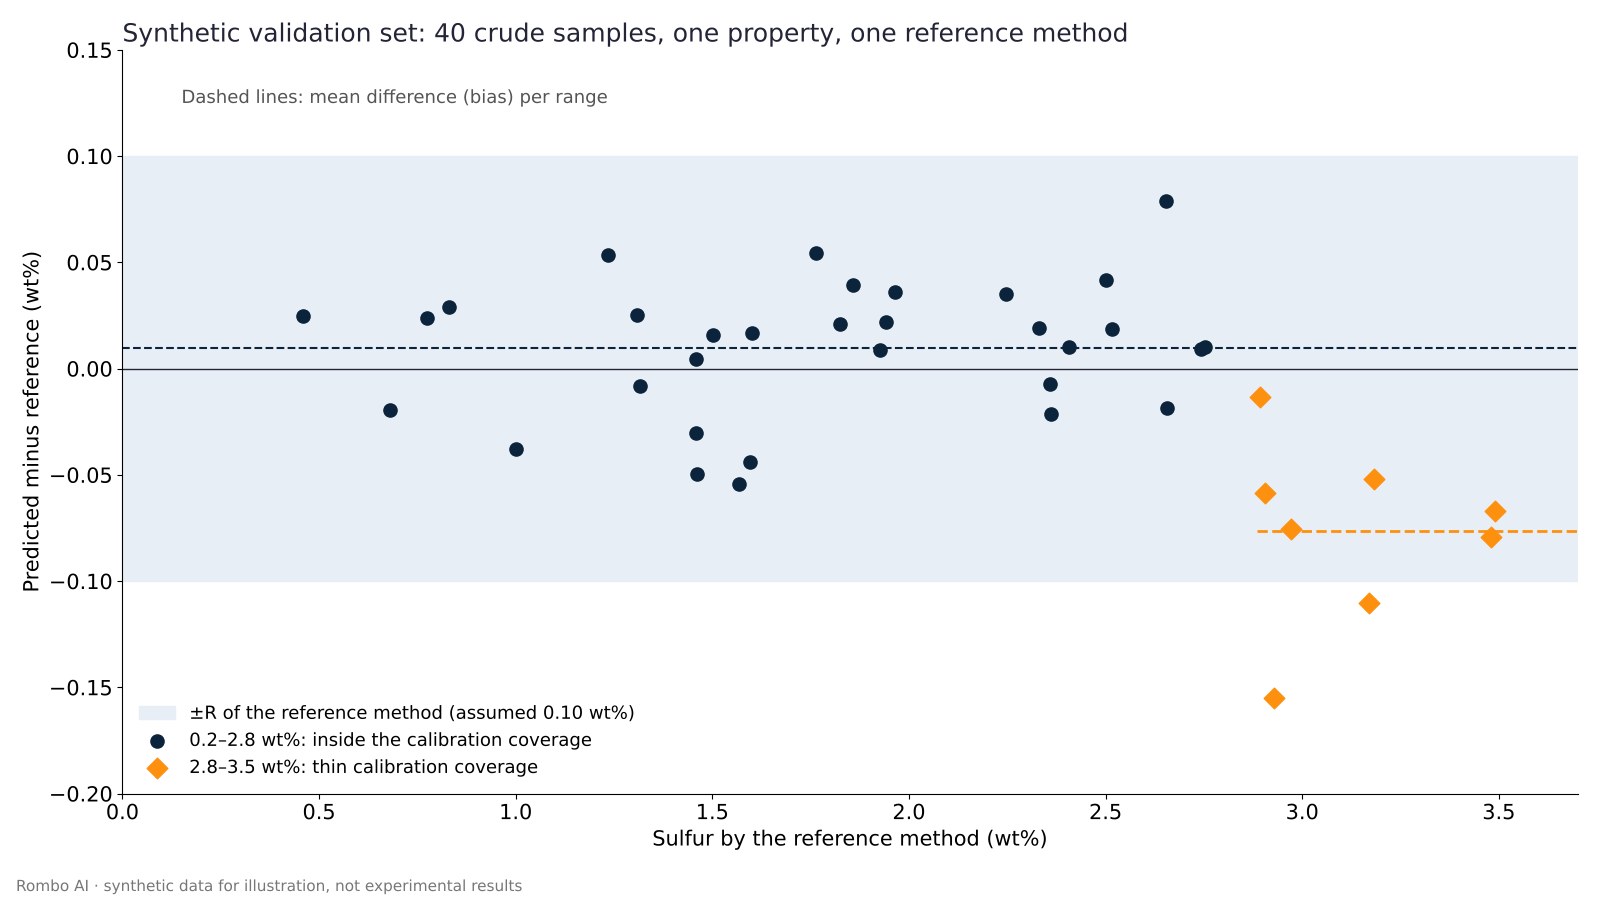
Setup. A lab wants to report total sulfur in crude oil from a benchtop proton NMR scan. The reference method is its X-ray fluorescence method, for example ASTM D4294. For the example we assume a reproducibility of R = 0.10 wt% across the range. This is a round illustrative figure: a real plan takes the value from the precision statement of the method and version the lab uses, where it usually changes with concentration.
Validation set. 40 crude samples not used in calibration, from 0.2 to 3.5 wt% sulfur. 32 fall between 0.2 and 2.8 wt%, where the calibration set is dense. Eight fall between 2.8 and 3.5 wt%: heavy sour grades that the calibration covers only thinly.
Criteria agreed in advance.
Results.
| Set | Samples | Mean bias (wt%) | RMSEP (wt%) | Within ±R | Bias test | Outcome |
|---|---|---|---|---|---|---|
| All samples | 40 | −0.008 | 0.048 | 38 of 40 | not significant (p = 0.32) | Pass |
| 0.2–2.8 wt% | 32 | +0.010 | 0.033 | 32 of 32 | not significant (p = 0.10) | Pass |
| 2.8–3.5 wt% | 8 | −0.076 | 0.086 | 6 of 8 | significant (p = 0.001) | Fail |
RMSEP is the root-mean-square error of prediction on the validation samples.
On the full set the model passes both criteria. Had the plan stopped there, the model would have been reported as validated from 0.2 to 3.5 wt%. The sub-range check tells a different story. On the eight heavy sour samples the model under-predicts by about 0.08 wt% on average, and the bias is significant. Six of the eight differences still fall within ±R, so the individual criterion alone would not have caught it. The two results outside the band, across the whole set, both come from this range.
What the lab does next was written into the plan:
The numbers are not the point of the example. The point is that the plan decided, before any data, to look at the sub-range, and decided what a partial pass leads to.
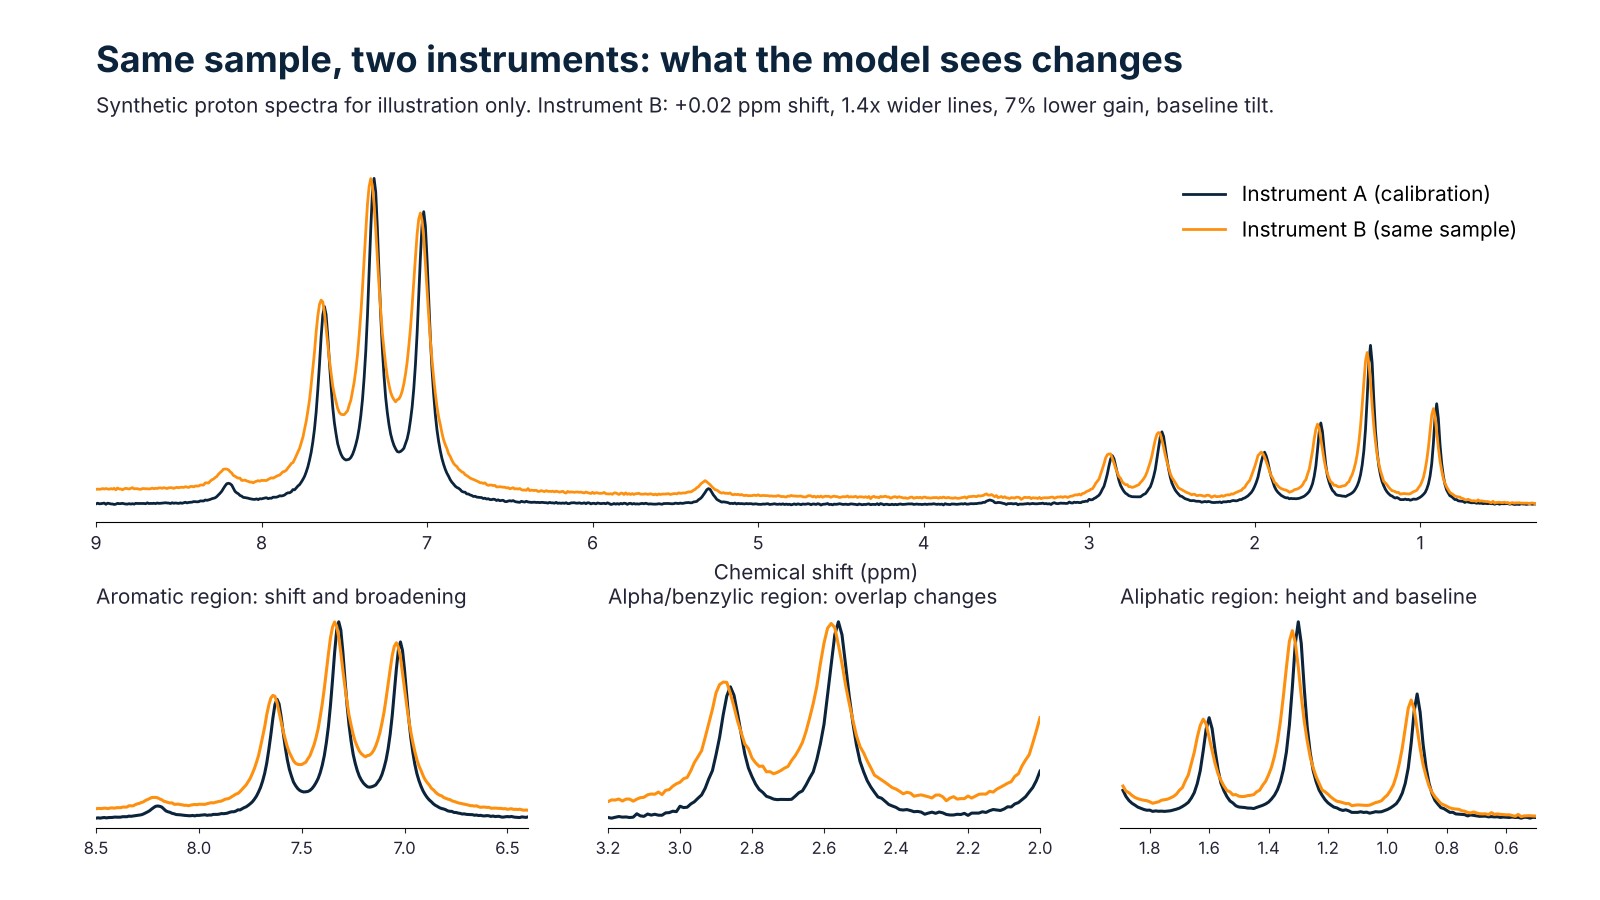
A validation is a snapshot. Three kinds of change can make it stale:
The routine answer is the one labs already use for their own methods: check samples plotted on control charts, as described in ASTM D6299, plus a share of routine samples re-tested by the reference method. Write into the plan which events trigger a re-validation, so it happens before a drift turns into a wrong decision.
Rombo AI builds property models on benchtop NMR spectra for crude oil, fuels and transformer oil. We benchmark each property against the customer’s reference method, on the customer’s samples, with the acceptance metrics agreed before the pilot starts. The chemist and the reference method stay in charge of the decision. The model is a faster route to a number, with a rule for when it should not be trusted.
Our foundation model is pre-trained on 3.2 million experimental, simulated and benchtop proton spectra and is published on GitHub. It is designed to reduce the calibration data each property needs and to carry across instruments. That changes the cost of building a model. It does not change how the model is proven: the plan above applies to it in full. We do not quote a single accuracy across properties; each one is established in a pilot.
If your lab is weighing a predictive method for a crude oil workflow, our feasibility review starts from this plan: your properties, your reference methods, a sample set and limits agreed before any result. To receive new guides on validation and calibration when they are published, you can subscribe to the Rombo AI newsletter at the bottom of this page.
Not in the sense the phrase suggests. The ASTM practices cited here describe procedures; the lab carries them out and documents the result. For an NMR property model, an accurate statement is that the validation follows the logic of D6122 and D6708, with the adaptations written down.
No. Cross-validation estimates how a model behaves on samples like its calibration set and helps choose its complexity. Validation needs samples kept out of model building and measured by the reference method.
More than one. RMSEP summarises the overall error, the mean bias shows a systematic offset, and the count of results within agreed limits ties the result to the reference method’s precision. Report each one per property and per sub-range.
Narrow the claim before widening the model. Report it as validated where it passed, send the rest to the reference method, and add calibration samples where it failed. Then validate again on new samples.
No. Pre-training can reduce the calibration samples a property needs. The validation set, the reference method and the acceptance criteria stay the same, because they test the result, not the way the model was built.
Posted by: Martina [Marketing Specialist, Rombo AI]
BOOK A DEMO
Share your analytical challenge with our team. We will assess technical fit, data or sample requirements, and the fastest path to a focused pilot.
Book a demo