Nov 02, 2026
Validating a Spectroscopic Property Model Against ASTM Reference Methods
How to validate a spectroscopic property model against your ASTM reference method: the practices,...
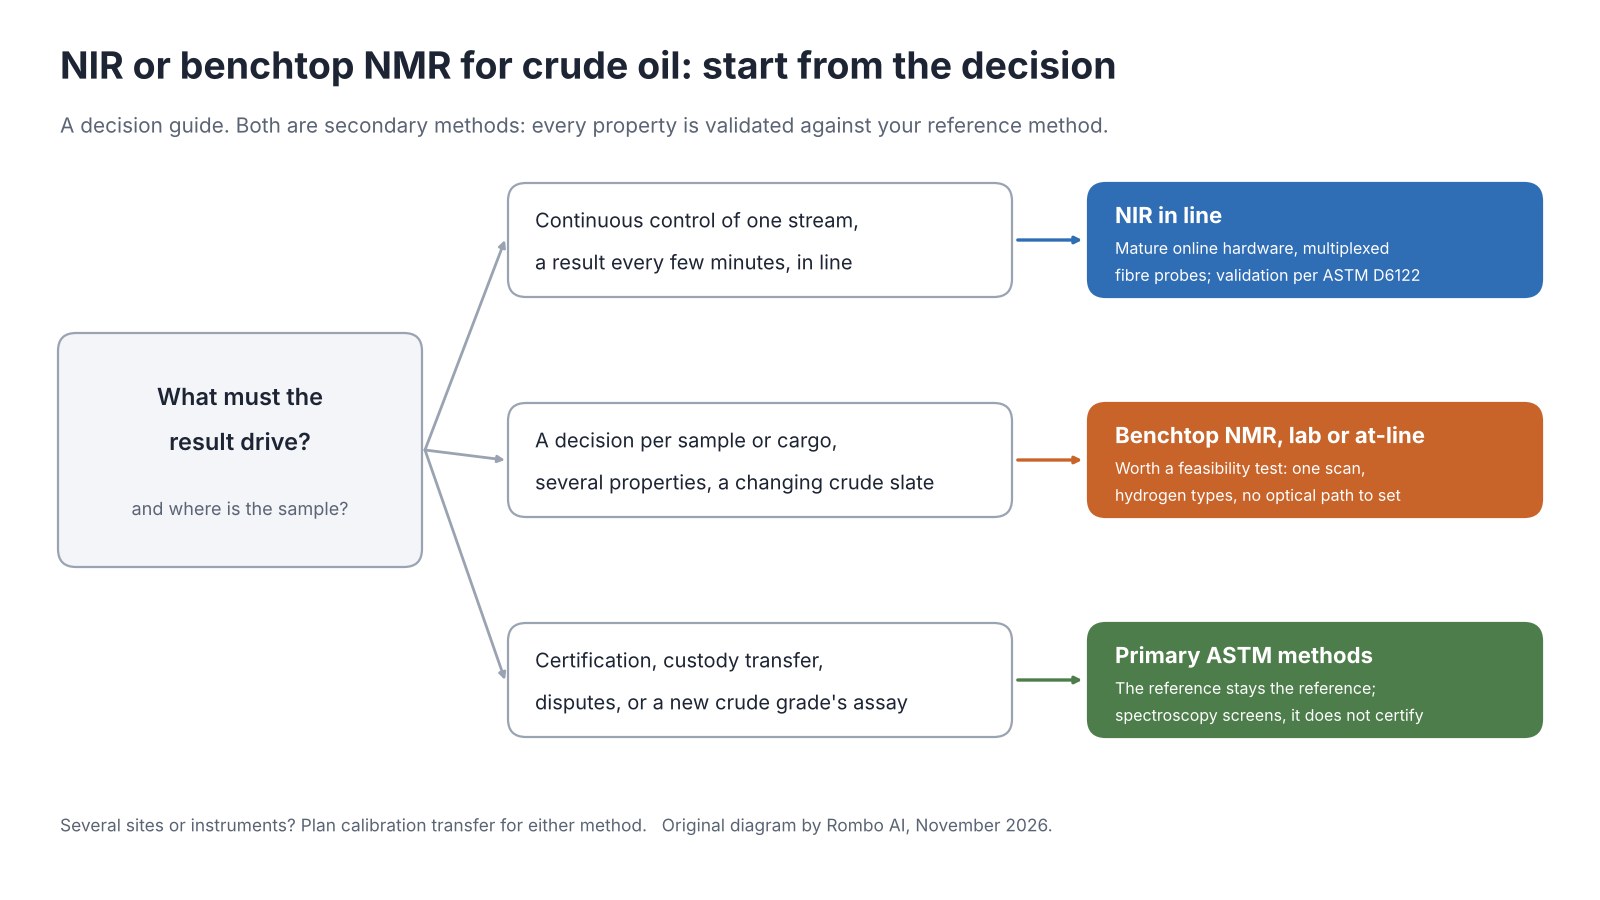
Use NIR where a calibrated, stable stream has to be measured in line, every few minutes, at several points. Consider benchtop NMR where a lab has to report several properties per sample on a crude slate that keeps changing. Neither replaces the reference method: both are secondary methods, and every property they predict has to be validated against the ASTM method your lab already trusts.
Last reviewed: 9 November 2026.
Both arrive in a crude oil lab with the same promise: replace a queue of separate tests with one spectrum and a model. Both are secondary methods. A model learns the relationship between spectra and reference values measured by primary methods, such as density by ASTM D5002 or sulfur by X-ray fluorescence under ASTM D4294, and then predicts those values for new samples. Our guide to validating a spectroscopic property model explains how such a prediction is proven.
The differences lie in what the spectrum contains, what the sample does to the measurement and where the instrument can sit. Our comparison of lab testing, NIR, high-field NMR and Rombo AI looks at cost and turnaround across four options. This guide stays with the two spectroscopies and one question: for the decision you need to support, which one fits?
NIR. Near-infrared spectroscopy covers roughly 750–2500 nm. A review by Pasquini describes the region as dominated by overtone and combination bands of O–H, C–H, N–H and S–H bonds, which are broad, weak and overlap one another. No single band maps to a property, so quantitative NIR depends on multivariate models. The light has to pass through the sample or scatter back from it, which brings path length, scattering and temperature into the measurement.
Proton NMR. In a magnetic field, hydrogen nuclei resonate at frequencies that depend on their chemical environment. The spectrum separates aromatic from aliphatic hydrogen and, with enough resolution, finer groups within each. Under the right acquisition conditions the area of each signal is proportional to the number of nuclei, which is why NMR can be used quantitatively; our introduction to quantitative NMR covers the principle. The conditions matter: Mondal and co-authors, measuring hydrogen content in petroleum products, used a 20 s delay between scans so that incomplete relaxation would not bias the integrals. Because the excitation is a radiofrequency pulse rather than light, the darkness of a heavy crude does not set a path length the way it does in NIR.
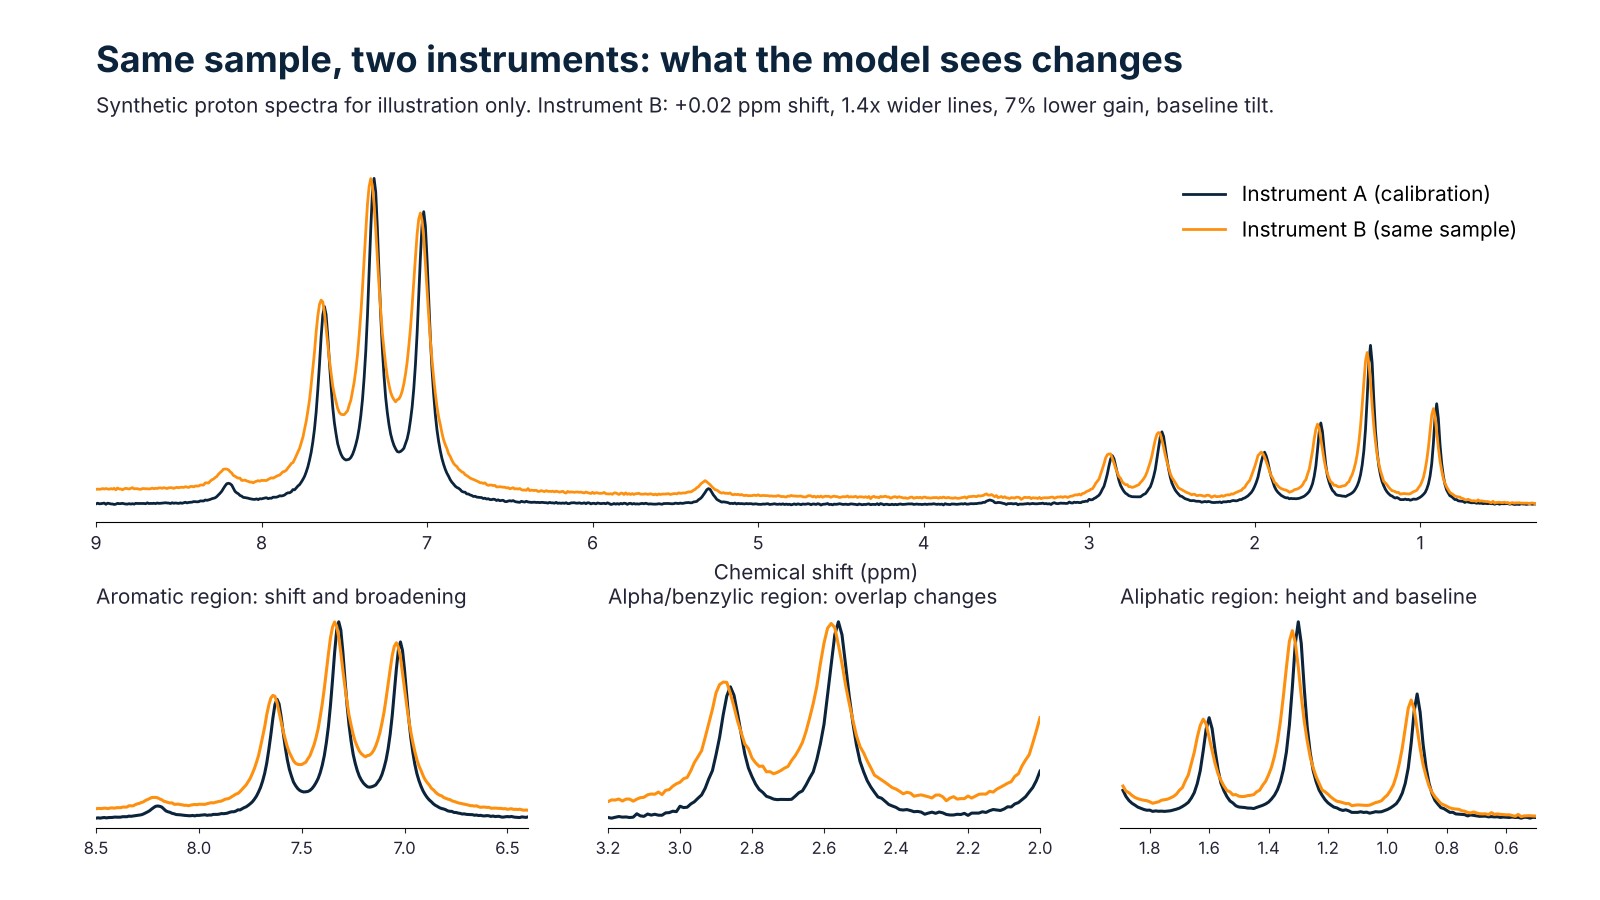
Benchtop is not the same as time-domain. Two different kinds of instrument are both called low-field NMR. Time-domain NMR measures relaxation and the total hydrogen signal; as a Magritek application note explains, it is used for total hydrogen content but lacks the frequency resolution to separate aromatic hydrogen, which the 43 MHz benchtop spectrometer in the same note resolves. Benchtop spectra still have less resolution than high-field spectra, so more signals overlap; our guide to calibration transfer shows why that matters when a model moves between instruments.
What neither method sees directly. API gravity, a distillation yield and total acid number are not peaks in either spectrum. Sulfur is the clearest case: a proton spectrum has no sulfur signal at all, and in both methods a sulfur value comes from a model trained on reference results, not from a dedicated sulfur measurement. The prediction holds where the calibration set represents your crudes, and published results for sulfur differ, as the next section shows.
Four peer-reviewed studies give a sense of what each method has achieved on crude oil. They are not a benchmark: the crudes, properties, instruments and statistics all differ.
| Study | Method | Samples | Properties | What the authors report |
|---|---|---|---|---|
| Pasquini and Bueno, Fuel, 2007 | NIR, transmission cell | 122 crudes and refinery blends, API 13.2–49.6 | True boiling point (TBP) curve, API gravity | On 22 validation samples: TBP error 1.13 vol% on average, against a reference reproducibility of 1.2–1.5 vol%; API gravity RMSEP 0.24 |
| Masili et al., Magnetic Resonance in Chemistry, 2012 | ¹H NMR at 300 MHz, neat crude | 64 crudes from 28 fields | K factor, density, TAN, sulfur, TBP yields | K factor, TAN and TBP yields comparable to the reference methods’ precision; density and sulfur less accurate but still useful |
| Sassu et al., Magnetic Resonance in Chemistry, 2020 | ¹H NMR on a 60 MHz benchtop | More than 170 crudes, with an external validation set | API gravity, sulfur, TAN, distillation yields | Prediction errors described as matching the precision of the ASTM reference methods |
| de Peinder et al., Vibrational Spectroscopy, 2009 | IR, ¹H NMR and ¹³C NMR on the same crudes | 48 crudes (28 calibration, 20 validation) | 7 long-residue properties, including sulfur, viscosity and asphaltenes | IR alone gave slightly lower errors than either NMR technique alone; combining them did not significantly improve the results |
Three readings follow.
None of these results transfers automatically to another lab’s crudes, or to any supplier’s model, Rombo AI’s included. They show what is possible and where to look hardest during validation.
NIR’s strengths are in the process. Process FT-NIR analyzers such as ABB’s FTPA2000-HP260 are offered for gasoline and diesel streams, final blending and units such as crude distillation and hydrocracking, with up to eight multiplexed fibre-optic channels per analyzer. ASTM D6122 covers the validation of laboratory, field and process (online and at-line) NIR, mid-IR and Raman analyzers for petroleum products and fuels. When a number has to arrive every few minutes from a pipe, on a stream that stays inside a calibrated range, that maturity is hard to beat.
Crude oil is a harder sample for light. In the Pasquini and Bueno study, the asphaltene-rich crudes were too dark and viscous for a long optical path, so the authors used a 0.5 mm transmission cell. A transflectance probe gave no usable spectrum even at 1 mm, which they attributed to scattering, and scattering above about 6500 cm⁻¹ grew worse for low-API crudes, so that region was left out of the models. They held the room at 22–24 °C and normalised the spectra for temperature and path length. None of this rules NIR out for crude. It means sample presentation is part of the method, and it gets harder as the crudes get heavier.
NMR’s case is in the lab and at-line. A benchtop spectrometer measures a sample in a tube and records the hydrogen distribution in one acquisition. Process NMR is used for industrial monitoring, as a review by Dalitz and co-authors describes, but the crude studies above measured their samples in the lab. The constraints differ from NIR’s: lower resolution at benchtop field strength, acquisition settings that keep the signal quantitative, and the same control of temperature and sample handling that any method needs.
Start from the decision the number drives and from where the sample is, not from the instrument.
| Your situation | Usually fits | Why | Check first |
|---|---|---|---|
| Continuous control of a blend or unit stream, with a result every few minutes | NIR in line | Mature online hardware with multiplexed probes; validation practice in D6122 | The calibration range covers the stream; temperature and sampling system |
| A stable product already calibrated on a lab NIR that passes its checks | Keep the NIR | A validated model that works on your samples is an asset | Control charts still pass; no new crude sources in the feed |
| A decision per cargo or tank on several properties, with a changing crude slate | Benchtop NMR, in the lab or at-line: worth a feasibility test | One scan of the hydrogen distribution; no optical path to set for dark crudes; published 60 MHz work on API gravity, sulfur, TAN and yields | Validation per property and per sub-range, including the heaviest crudes |
| Heavy, dark crudes measured in the lab | Either, with care | NIR needs short-path transmission and temperature control; NMR needs quantitative acquisition settings | Spectral quality on your heaviest sample before any model |
| Certification, custody transfer, disputes or the full assay of a new grade | Primary ASTM methods | The reference stays the reference | Neither spectroscopy certifies a result |
| Several instruments or sites | Either | A model moves between instruments only with a transfer plan | Our calibration transfer guide |
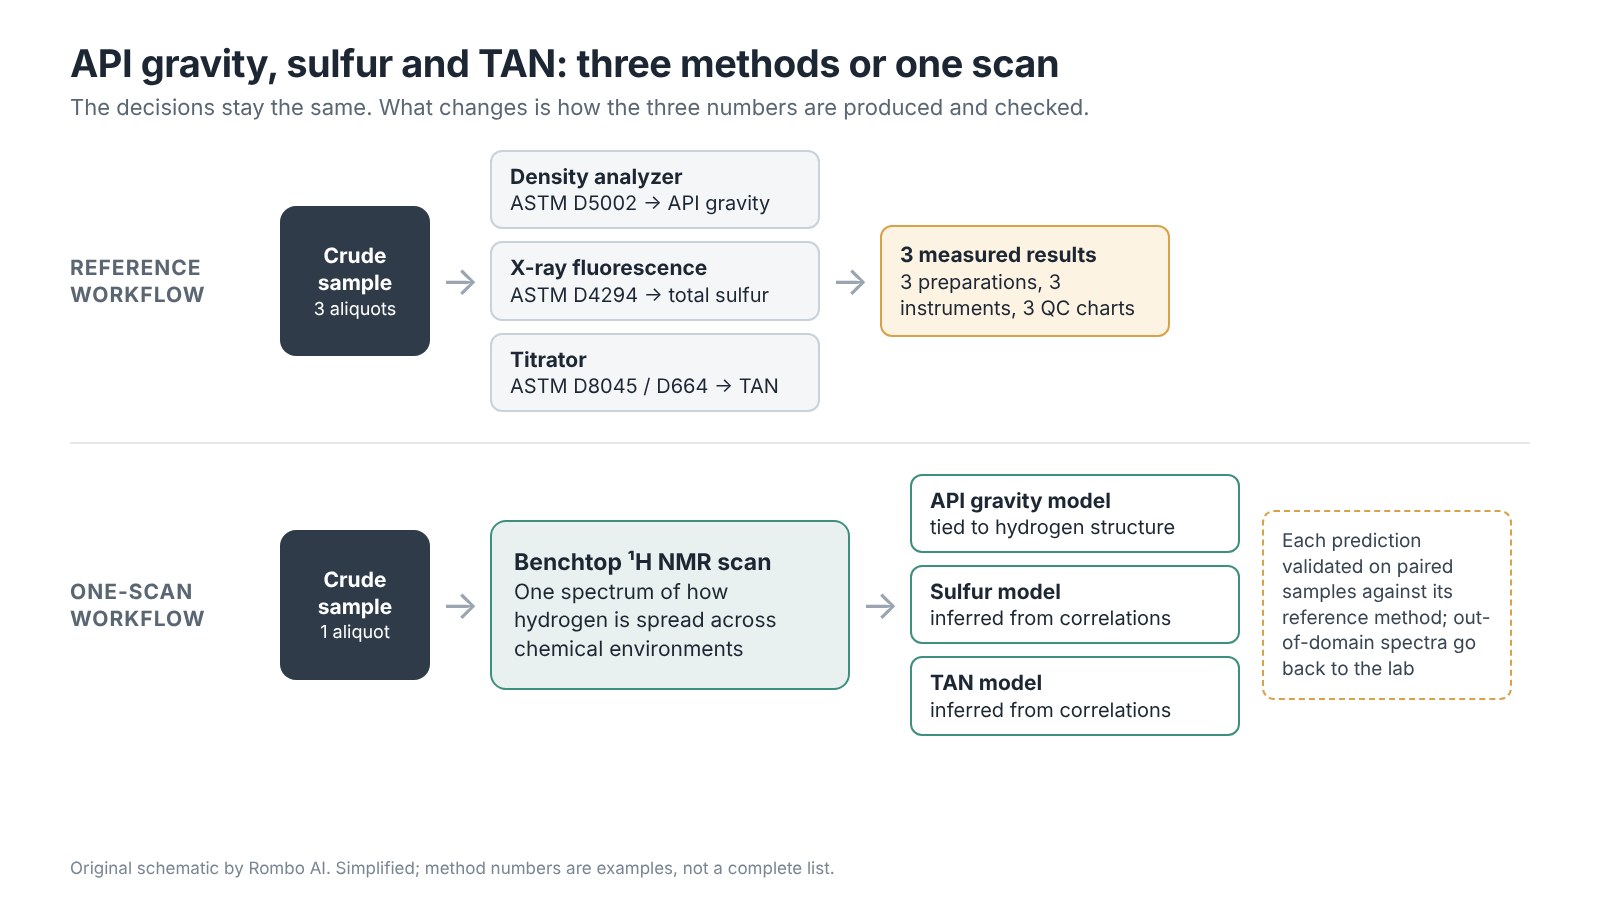
Take a hypothetical refinery lab that receives crude by ship and by pipeline from a slate that changes month to month. For each receipt it reports density by D5002, sulfur by D4294 and acidity by the thermometric method ASTM D8045 before the tank is assigned to a blend. Where those three tests sit in a crude lab, and what changes when one measurement covers them, is the subject of our API gravity, sulfur and TAN workflow. The question here: can a spectroscopic screen give the three numbers within the shift, so that the reference tests run on a subset of samples?
With NIR, the lab would use a short-path cell at controlled temperature and build a calibration from the crudes it has already received. The risk sits with the next new grade. If it falls outside the calibration, the model should flag it as an outlier and send it to the reference methods, and the calibration grows over time. If the slate is stable, this works, and the lab may already own the instrument.
With benchtop NMR, the lab would obtain the same three properties from one proton spectrum, with the same outlier logic and the same validation. What needs testing is whether the model covers the heavy and high-sulfur end of the slate, where the published results differ most.
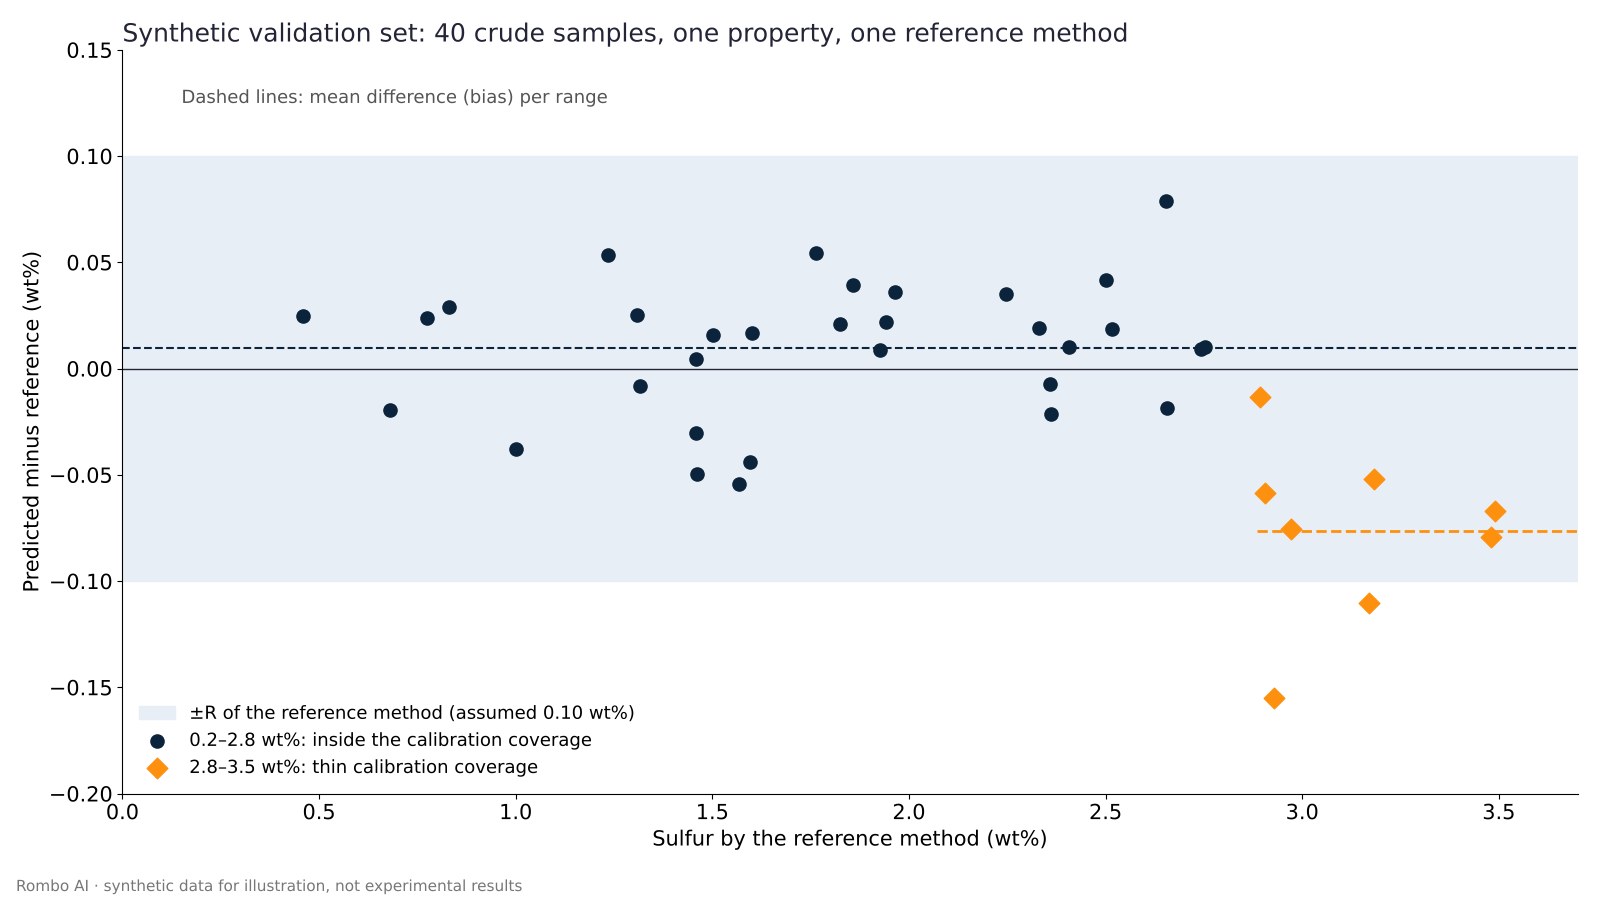
Either way, the validation plan is the same: independent samples across the slate, acceptance limits tied to the reference method’s precision, a sub-range check for the heaviest and most sour crudes, and a rule for samples the model flags. If both methods pass, the choice comes down to practical factors: sample handling, how many properties one measurement carries and how much reference data each new crude source requires. Where the crude is sampled, and which decision each result feeds, is covered in why crude oil analysis matters at every stage of the refinery.
Rombo AI builds property models on benchtop NMR spectra for crude oil, fuels and transformer oil: the lab and at-line case in the decision guide above. The models start from a foundation model pre-trained on 3.2 million experimental, simulated and benchtop proton spectra and published on GitHub. It is designed to reduce the reference data each property needs and to carry across instruments. That has to be shown on your samples: each property is benchmarked against your reference method, with acceptance metrics agreed before the pilot.
Rombo AI is not an in-line process analyzer. Where a validated NIR already passes its checks on a stable stream, keeping it is often the right call.
If your lab handles a changing crude slate, the crude oil monitoring use case shows the workflow, and our feasibility review starts from your properties and your reference methods. To receive new guides like this one, you can subscribe to the Rombo AI newsletter at the bottom of this page.
There is no general answer. Accuracy depends on the property, the crude slate, the instrument and the reference method. The one head-to-head study we found favoured infrared, while other studies report NMR close to reference precision for some properties; compare both on your own validation set.
Yes, with the right sample presentation. In a published study, dark and viscous crudes needed a 0.5 mm transmission cell, temperature control and the exclusion of a spectral region affected by scattering. Expect more effort as API gravity falls.
Time-domain NMR measures relaxation and the total hydrogen signal, without chemical-shift resolution. A benchtop NMR spectrometer records a chemical-shift spectrum that separates aromatic from aliphatic hydrogen, at lower resolution than a high-field instrument.
No. Both are secondary methods. They can reduce how often reference tests run, but the reference method remains the basis for validation, for checks over time and for any result used in certification or custody transfer.
They can, but the evidence for a gain is limited. In the study by de Peinder and co-authors, combining infrared with proton and carbon NMR did not significantly improve predictions over infrared alone.
Posted by: Martina [Marketing Specialist, Rombo AI]
BOOK A DEMO
Share your analytical challenge with our team. We will assess technical fit, data or sample requirements, and the fastest path to a focused pilot.
Book a demo