Oct 21, 2026
API Gravity, Sulfur and TAN in One Workflow: What Changes for the Crude Lab
How crude labs measure API gravity, sulfur and total acid number today, what each result decides,...
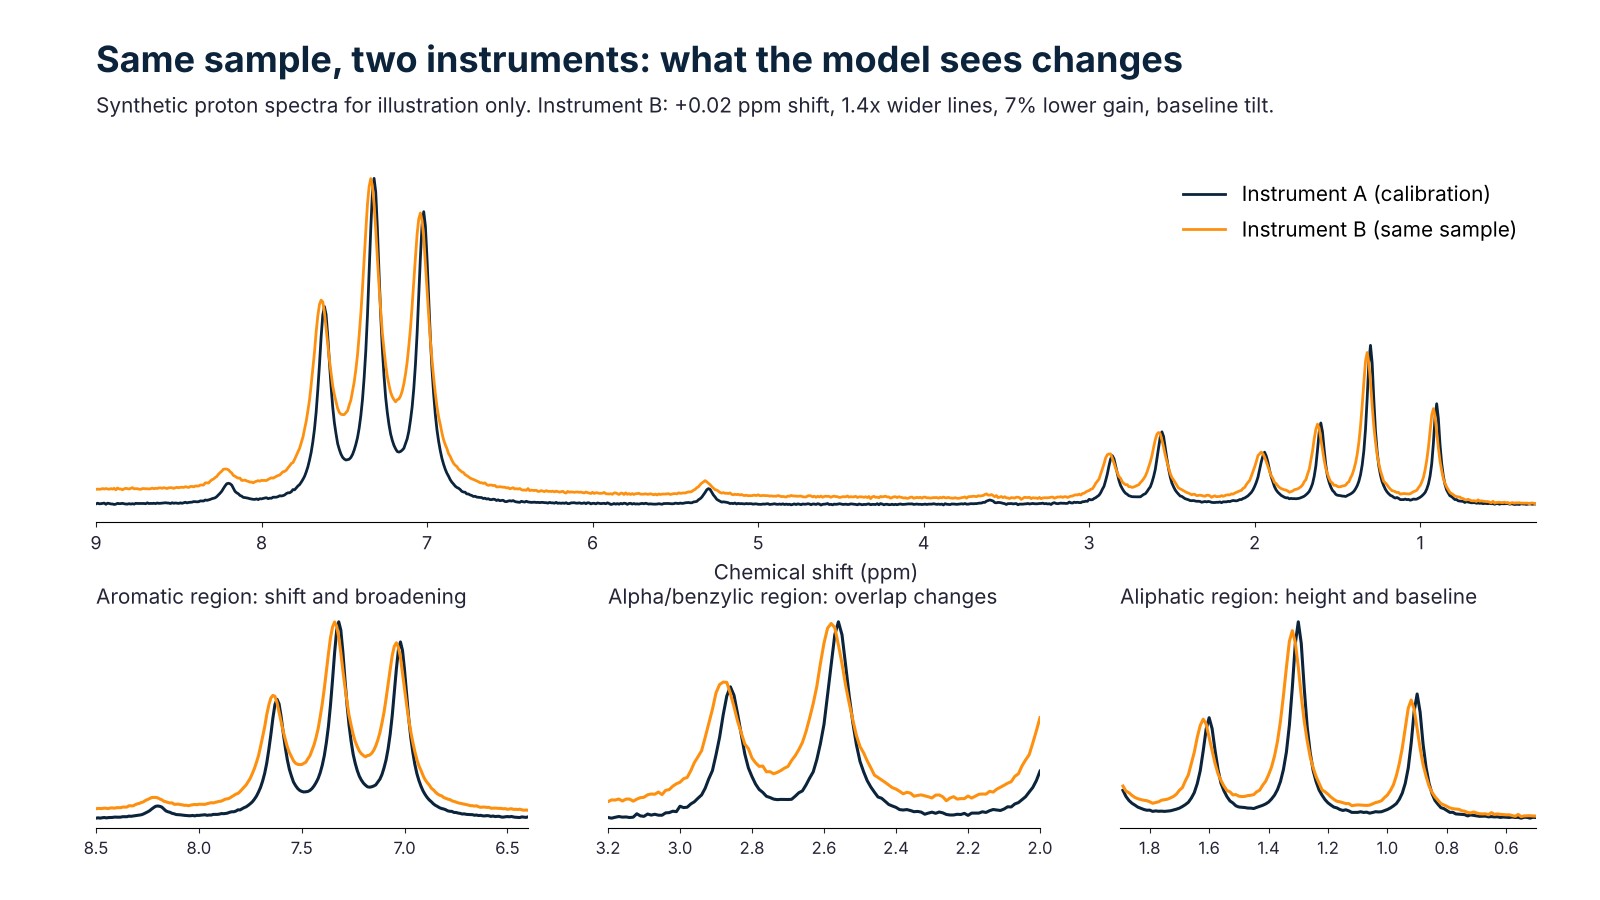
A calibration model learns the link between spectra and a property on one instrument. A second instrument records the same sample with a different line shape, shift, gain and baseline, so the model receives an input it has not seen and its predictions drift. Calibration transfer corrects that gap, or avoids it, before the model is used for decisions.
Last reviewed: 26 October 2026.
A partial least squares (PLS) model maps a spectrum, treated as a list of numbers, to a property. It has no concept of an instrument. It knows only what the calibration spectra looked like, so anything that changes how the same chemistry appears in the spectrum moves the input outside what the model has seen.
Workman and Mark’s review of calibration transfer lists the usual sources: differences in instrument response between a parent and a child instrument, long-term drift, temperature, scattering differences and unmodeled variation in the samples themselves. Feudale and co-authors give the broader review of the methods that address them.
In proton NMR, four effects matter most:
None of these changes the chemistry. All of them change what the model reads.
Transfer methods differ mainly in what they ask of the laboratory: spectra of shared samples, reference-method results, or neither.
| Approach | What the lab provides | What it corrects | Main limit |
|---|---|---|---|
| Slope and bias correction | Predictions of the same samples on both instruments | A constant offset and scale in the predicted values | Cannot repair shifts or line-shape changes that affect different variables differently |
| Direct standardization (DS) | Spectra of transfer samples measured on both instruments | One global linear map from the second instrument’s spectra to the first | Assumes a single linear relation holds across the whole spectrum |
| Piecewise direct standardization (PDS) | Spectra of transfer samples measured on both instruments | Local linear maps: each variable of the first instrument is predicted from a window of variables on the second | More settings to choose (window width, latent variables); the transfer samples must span the range |
| Recalibration on the second instrument | New samples with reference-method results, measured on the second instrument | Whatever the new samples cover | Needs reference results; the cost grows with every property and instrument |
| Invariance at training time | Data from several instruments in the calibration set or in pre-training | Differences represented in the training data | Cannot cover differences it has never seen |
PDS, introduced by Wang, Veltkamp and Kowalski in 1991, is still the commonly used method that newer approaches are compared against in the Workman and Mark review. Brown’s chapter on transfer of multivariate calibration models reviews the wider set of methods.
NMR transfer across field strengths has been tested. In a 2022 study in Analytical Chemistry, Lindner and co-authors moved a PLS calibration for lignin molecular weight from a 600 MHz instrument to benchtop instruments at 43 and 60 MHz using PDS, canonical correlation analysis and an extreme learning machine auto-encoder. The study listing reports validation errors as low as about 1.2 times those of the original calibration. That is one property, one sample type and one team’s setup. It shows that transfer can work despite a large resolution gap, not that it will for your samples.
The example below is a simulation, so every assumption is on the page. It shows how the methods behave, not how any product performs.
Assumptions
Results
| Scenario | RMSEP (mean ± SD) | Relative to A on A |
|---|---|---|
| Model built on A, tested on A | 0.50 ± 0.06 | 1.0 |
| Model built on A, tested on B, no correction | 2.39 ± 0.26 | 4.8 |
| Slope and bias correction, 20 transfer samples | 0.69 ± 0.09 | 1.4 |
| PDS, 20 transfer samples | 0.62 ± 0.07 | 1.2 |
| New model on B, 100 reference-labelled samples | 0.59 ± 0.07 | 1.2 |
| New model on B, 40 reference-labelled samples | 0.66 ± 0.10 | 1.3 |
| New model on B, 20 reference-labelled samples | 0.79 ± 0.10 | 1.6 |
| New model on B, 10 reference-labelled samples | 1.04 ± 0.23 | 2.1 |
Three points follow from the table.
What the simulation does not show. It has no matrix effects, no new sample types, and its instrument differences are stable and smooth, which is what these methods handle best. Real gaps are less tidy, so the sample counts above are not a guide for a real transfer. They show the shape of the trade-off: paired spectra are cheaper than new reference results, and they correct only what the transfer samples span.
There is no universal number. The useful rules are qualitative.
Treat the transferred model as a new method on the second instrument.
For infrared analyzers in petroleum laboratories, ASTM D6122 frames this kind of validation: instrument performance, whether the model applies to each spectrum, and agreement with the primary test method. The practice is written for infrared systems and does not describe a transfer procedure. The same logic is a sensible way to structure the work for any spectroscopic analyzer.
Rombo AI builds property models on NMR spectra and benchmarks each property against the customer’s reference method, with acceptance metrics agreed before a pilot starts. Our foundation model is pre-trained on 3.2 million experimental, simulated and benchtop proton spectra, with an objective that pulls together spectra of the same molecule recorded at different field strengths. It is designed to need fewer reference samples per property and to carry across instruments. The evaluation described in that post covers molecular identity tasks such as classification and structure retrieval. It does not report property calibration on crude oil or transformer oil, so it does not by itself show that a given property transfers.
That is why the test belongs on your instruments: paired samples on each, predictions compared with your reference method, acceptance limits agreed first. For a crude oil lab or a transformer oil lab with more than one NMR system or site, a feasibility review starts from your own samples and reference methods, and paired measurements on each instrument belong in the test design. Our posts on multi-instrument compatibility and multi-site deployment describe the architecture; the comparison of lab testing, NIR and high-field NMR covers the alternatives. To test transfer on your own samples, start with a feasibility review.
Sometimes. If the two instruments give predictions that differ by a constant offset and scale, a slope and bias correction fixes it with a few paired samples. If peaks have shifted or broadened, the error is not constant across the spectrum and the correction leaves part of it in place, as the simulation shows.
Not necessarily, but you should check. Run a few paired or reference samples after the service and compare with the validated performance. A small, constant change can be handled by correction; a large or irregular one may justify a new transfer or recalibration.
It has worked for at least one property. Lindner and co-authors transferred a lignin molecular weight calibration from 600 MHz to 43 and 60 MHz instruments with errors close to the original, per the study listing. Whether it works for another property depends on whether the information is still resolved at the lower field.
Part of the problem is easier. A chemical-shift axis referenced to a standard removes much of the wavelength alignment issue that NIR labs know. Line shape, resolution, gain and baseline differences remain, and so does the need to validate against the reference method. Our comparison of lab testing, NIR and high-field NMR covers where each technique fits.
It depends on the property, the sample diversity and the method. In the simulation above, a rebuilt model needed about 40 labelled samples to match transferred ones, while paired samples without reference results got close with 10 to 20. Real data are less forgiving, so plan the count with your own samples and validate on a separate set.
When the instruments differ in ways a transfer cannot span, for example a new sample type or a large change in resolution, or when reference results are cheap and the property set is small. Transfer is most attractive when you have many properties, several instruments or sites, and reference tests are the expensive part.
Posted by: Martina [Marketing Specialist, Rombo AI]
BOOK A DEMO
Share your analytical challenge with our team. We will assess technical fit, data or sample requirements, and the fastest path to a focused pilot.
Book a demo