Oct 19, 2026
Transformer Oil Testing: Which Properties Matter, How They Are Measured, and Where NMR Fits
Which insulating oil properties utility labs test, which IEC and ASTM methods measure them, what ...
·
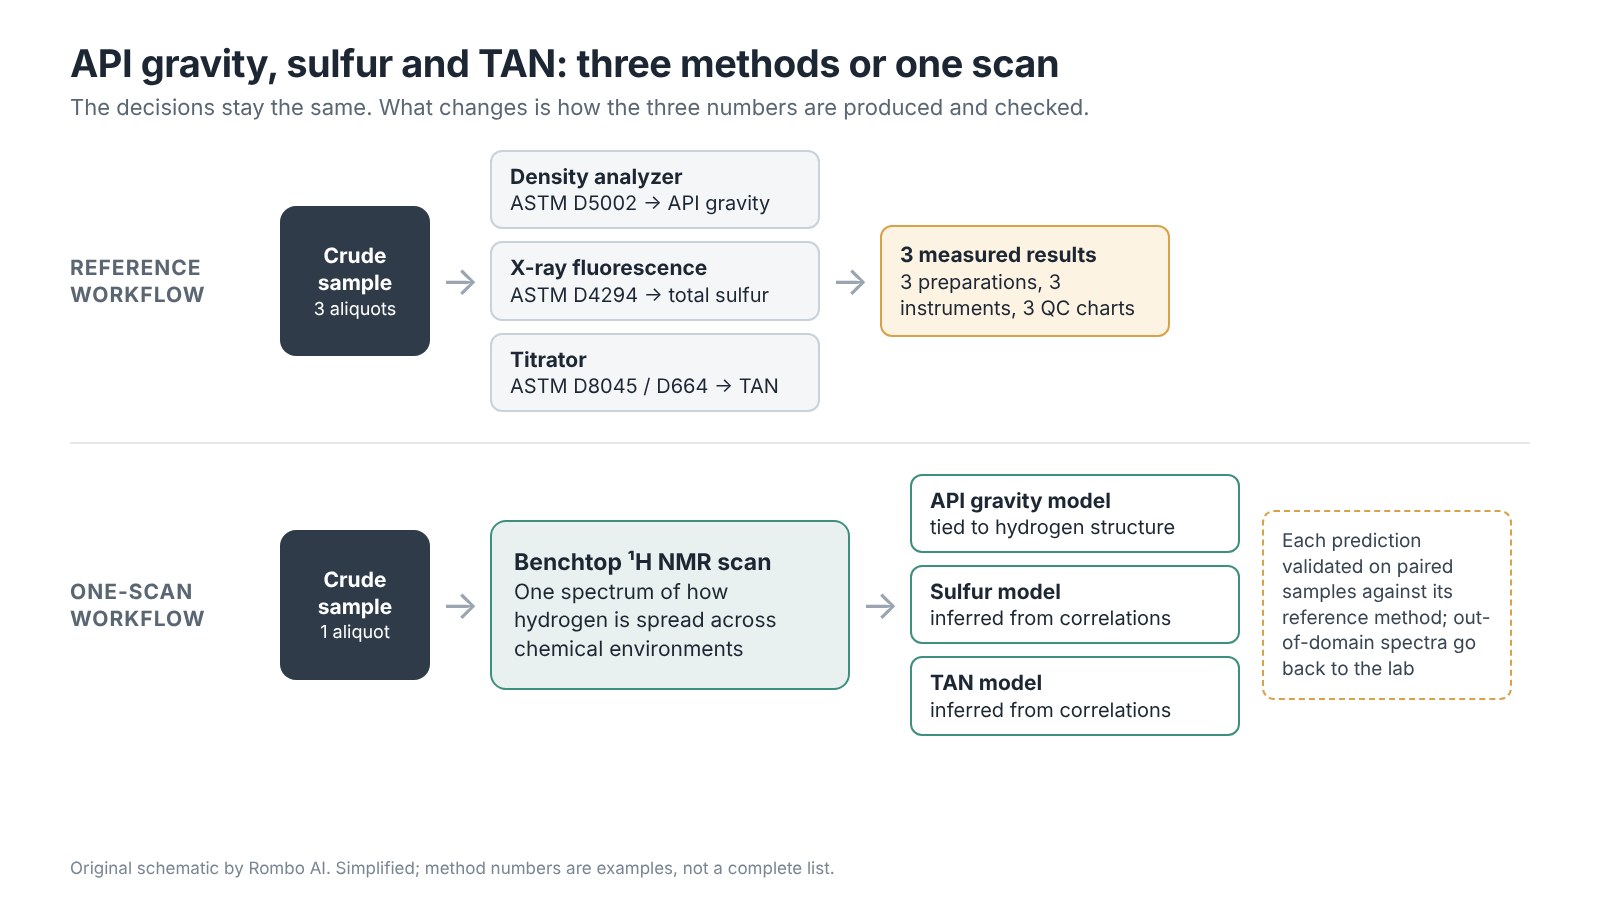
Crude labs rarely read these three numbers in isolation. A new cargo, a tank blend or a change of slate triggers all three, and the answers feed the same decisions: accept, segregate, blend or flag for corrosion review. This note looks at the reference workflow first, then at what changes, and what does not, when one benchtop NMR scan replaces three measurements. For where crude is sampled across the refinery and why, see Why Crude Oil Analysis Matters at Every Stage of the Refinery.
| Property | Typical reference method | What the result supports | What it cannot tell you alone |
|---|---|---|---|
| API gravity | Digital density analyzer, e.g. ASTM D5002 for crude oils | Volume correction to standard temperature, light/heavy classification, blend calculations | Yields, compatibility or product quality |
| Total sulfur | Energy-dispersive X-ray fluorescence, e.g. ASTM D4294 | Treating and hydrodesulfurization load, product specifications, crude valuation | Which sulfur compounds are present or how corrosive they are |
| TAN (total acid number) | Titration, e.g. ASTM D8045 (thermometric) or ASTM D664 (potentiometric) | Screening of acidic crudes, blend limits, input to corrosion review | The corrosion rate of a given unit |
API gravity is derived from relative density (specific gravity, SG) at 60 °F: API = 141.5 / SG − 131.5. A crude with a relative density of 0.876 therefore sits at about 30 °API. The scale runs opposite to density: lighter crudes have higher API values.
The last column matters as much as the third. Tebbal and Kane’s review of crude corrosivity (NACE CORROSION 1996) notes that total sulfur and TAN thresholds have long served as rules of thumb, and that they are not accurate predictors on their own. Naphthenic acid content, sulfur compounds, velocity, temperature and materials of construction act together. A faster TAN does not change that.
Each method brings its own handling.
Density. ASTM D5002 covers crude oils that can be handled as liquids between 15 °C and 35 °C. Light, volatile crudes need care to avoid vapor loss during transfer. For custody transfer, the density result may also need water and sediment measured on the same parcel.
Sulfur. ASTM D4294 lists crude oil within its scope. Its interlaboratory precision covers 17 mg/kg to 4.6% by mass; samples above that range are diluted, at the cost of larger errors.
Acidity. Crude is a difficult matrix for titration. The ASTM D8045 scope notes that D664 was developed for lubricants and biodiesel and that its solvent does not dissolve some crudes, bitumen and waxy samples well, while color-indicator methods struggle with dark samples. Different acid number methods may not give numerically equivalent results, so the method belongs on the report next to the number.
In practice, that is one sample split into three aliquots, three preparations, three instruments to calibrate and three sets of quality control charts. None of this is wasted effort: it is what makes the results defensible.
A proton (¹H) NMR spectrum records how hydrogen is distributed across aromatic, aliphatic and other chemical environments; our introduction to quantitative NMR explains why the signal areas are quantitative. Property models translate that fingerprint into estimates. This is the practical core of NMR crude oil analysis, and it is published. Sassu et al. (Magnetic Resonance in Chemistry, 2020) built partial least-squares models on 60 MHz benchtop spectra of more than 170 crude oils to estimate API gravity, sulfur, TAN and distillation yields. On an external validation set, the authors report prediction errors in line with the precision of the corresponding ASTM methods, with results available within minutes. That supports the approach for the crude population they studied; it does not validate other models or other slates.
What changes in the lab:
A worked example shows how small the acid signal is. A TAN of 1.0 mg KOH/g corresponds to 1.0 / 56.1 ≈ 0.018 mmol of acid groups per gram, or about 18 mmol/kg. Assume, for illustration, a crude with 13% hydrogen by mass: it holds roughly 130 mol of hydrogen per kilogram. If each acid group carries one acidic proton, that is about one hydrogen in 7,000. A model that predicts TAN is therefore learning correlations, and those correlations hold only as far as the calibration set represents your crudes.
The validation logic is the same as for any new method, applied property by property. Our comparison of lab testing, NIR and high-field NMR sets the alternatives side by side on common criteria.
Plan for the three properties to behave differently. Where the slate is diverse or includes acidic crudes, sulfur and TAN are the properties most likely to need extra reference samples, for the reasons above.
Rombo AI builds property models on NMR spectra and benchmarks each property against the customer’s reference method, with acceptance metrics agreed before a pilot starts. Our foundation model is pre-trained on NMR spectra and is designed to need fewer reference samples per property and to carry across instruments. Whether it does so for API gravity, sulfur and TAN on your crudes is something to show on paired samples, not to assume. The crude oil monitoring use case describes how the workflow is set up. To test it on your own samples and methods, start with a feasibility review.
Not as a blanket replacement. A validated NMR-based model can provide fast estimates for routine samples; the reference methods remain for out-of-domain samples, disputes and periodic checks.
Not at typical TAN levels: acid protons are around one hydrogen in several thousand. Models estimate TAN from correlated spectral features, which is why the calibration crudes must represent your slate.
No. Corrosivity also depends on the acid species, sulfur compounds, temperature, velocity and metallurgy. A faster TAN helps screening and blending decisions; corrosion assessment still needs the wider review.
Posted by: Martina [Marketing Specialist, Rombo AI]
BOOK A DEMO
Share your analytical challenge with our team. We will assess technical fit, data or sample requirements, and the fastest path to a focused pilot.
Book a demo