Oct 14, 2026
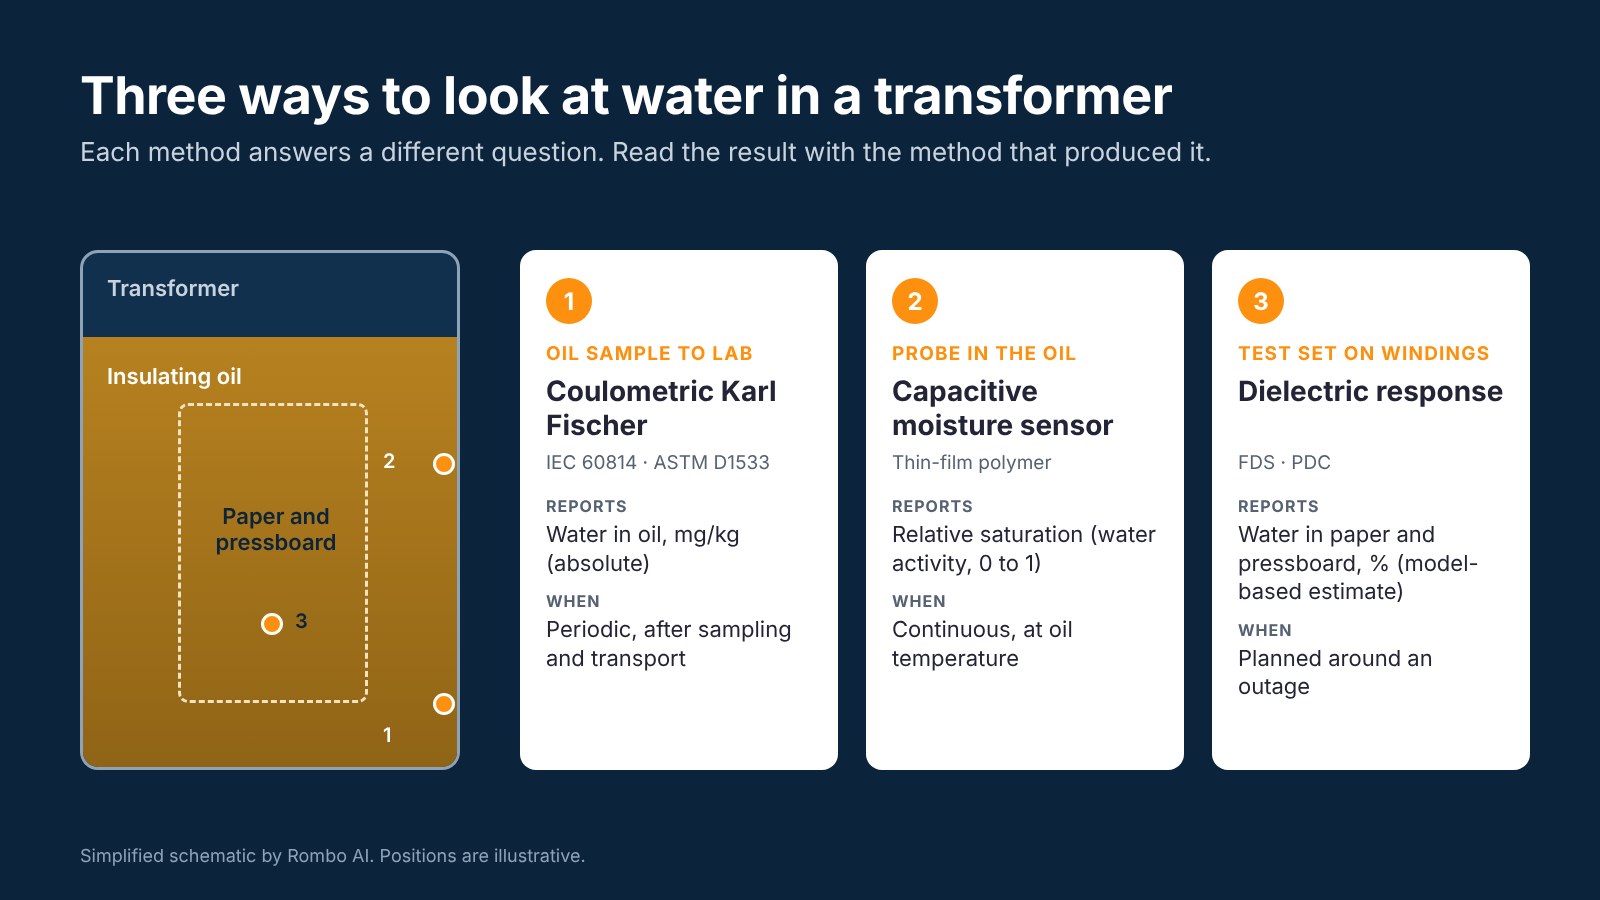
How to Measure Water Content in Transformer Oil: Karl Fischer (IEC 60814) and Faster Alternatives
How coulometric Karl Fischer titration (IEC 60814, ASTM D1533) measures water in transformer oil,...
·
A refinery buys a complex mixture whose value depends on what the plant can make from it and what processing demands it creates. Two cargoes with similar density can differ in sulfur, acidity, boiling distribution and blend stability. Those differences affect equipment loading, energy demand and saleable product output.
The familiar sequence—distillation, conversion, treating and blending—is therefore also a map of analytical decisions. Three checkpoints organize it: incoming crude and storage; feed preparation and processing; fractions and finished products. Actual refineries have recycle streams and parallel units, so sampling follows the site’s process configuration.
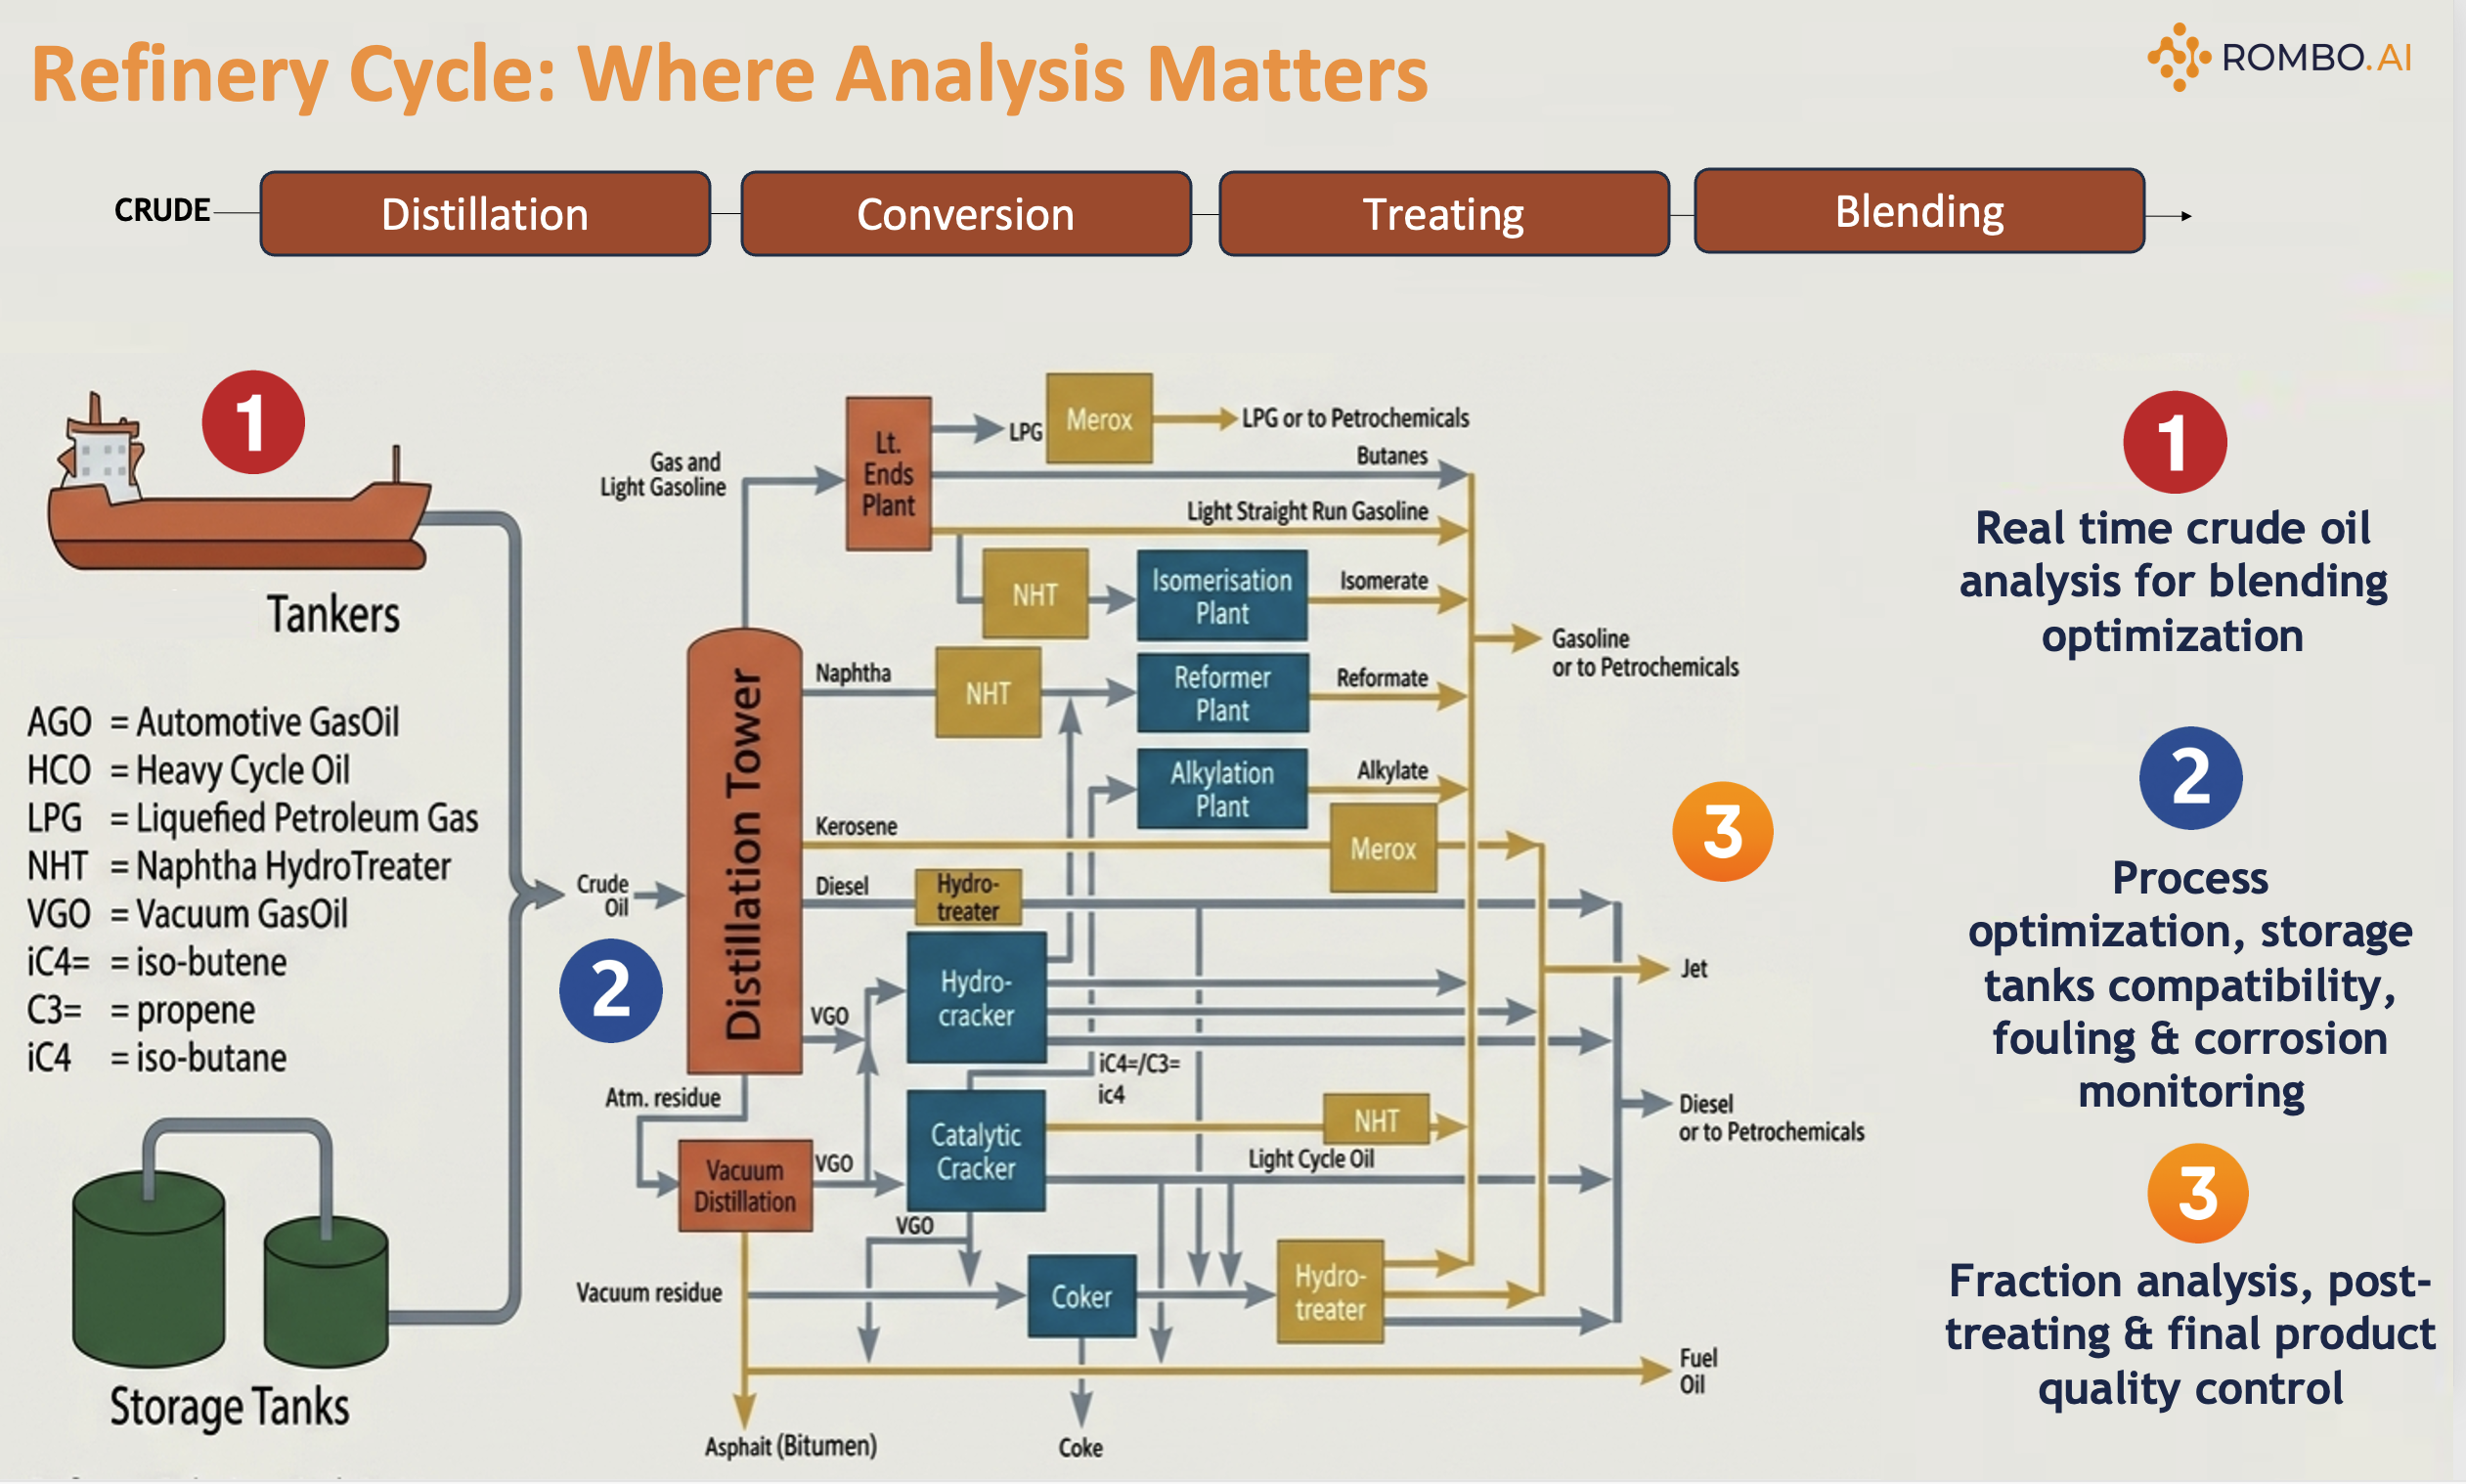
| Sampling point | Main analytical question | Decision supported |
|---|---|---|
| Cargo or pipeline receipt | Does this delivery match the expected crude quality? | Acceptance, segregation and updated planning |
| Storage tank | Is composition uniform across depth and during withdrawal? | Mixing, recirculation and feed scheduling |
| Blend header | Does the actual blend satisfy feed constraints? | Blend ratios and routing |
| Desalter inlet/outlet | Are water, salt and solids being removed adequately? | Desalter operation and investigation of carryover |
| Preheat train | Is changing feed associated with heat-transfer loss or deposition? | Feed review, monitoring and cleaning strategy |
| Distillation draws | Are boiling ranges and fraction qualities on target? | Cut points, draw rates and downstream allocation |
| Conversion units | Is feed suitable, and are products responding as expected? | Severity, catalyst protection and unit loading |
| Treating outlets | Has treatment achieved the required quality? | Treatment adjustment and further testing |
| Product tanks | Does the final blend meet its specification? | Reblending, release and shipment |
A receipt sample answers a commercial question. A blend-header sample represents what is actually entering the plant. Neither automatically represents every layer of a storage tank. Manual petroleum sampling has its own ASTM practice, D4057; sampling location, timing, handling and sample identity belong beside every result.
Density and API gravity. A digital density meter measures the response of an oscillating tube containing the sample at a controlled temperature; API gravity expresses relative density on the petroleum industry’s scale. These measurements support inventory conversion and crude comparison. They cannot independently establish product yield or compatibility.
Viscosity. A capillary method measures flow time at a specified temperature to determine kinematic viscosity. It informs pumping, heating and mixing requirements. Temperature must accompany the result: comparing viscosities measured under different conditions can mislead an operating decision.
Water and sediment. Centrifugation provides a combined screening result, while dedicated water methods such as Karl Fischer titration and separate sediment tests resolve the components. Water and entrained solids reduce usable hydrocarbon volume and can burden separation equipment. A sample taken above settled water may miss the problem entirely.
Salt. Conductivity-based procedures estimate salt under specified preparation conditions. Sampling before and after desalting helps assess removal and investigate downstream chloride-related problems. Online salt analyzers already exist, as illustrated by Metrohm’s petroleum analysis portfolio; conventional analysis is not uniformly slow or offline.
Sulfur. X-ray fluorescence measures characteristic elemental emission; combustion methods provide another route appropriate to selected matrices and ranges. Sulfur results guide treatment requirements and product-quality control. ASTM D4294 describes an XRF method, with applicability and matrix effects that laboratories must check.
Total acid number, or TAN. Potentiometric titration measures neutralizable acidic constituents, conventionally expressed as milligrams of KOH per gram. TAN supports feed assessment, but corrosion also depends on acid chemistry, temperature, sulfur species, water and metallurgy. A TAN value alone does not predict an equipment corrosion rate.
Metals, nitrogen and carbon residue. Elemental spectroscopy measures metals such as nickel and vanadium after suitable preparation; combustion-based methods quantify nitrogen. These results inform catalyst and treatment constraints. Carbon-residue testing heats material under prescribed conditions and weighs the residue as an indicator of coke-forming tendency. It is not a direct measurement of future furnace deposits. The ASTM petroleum-method collection identifies relevant methods for these properties.
An inspection panel selects tests for immediate decisions. A comprehensive assay combines broader whole-crude testing with fractionation and analyses of individual cuts. Its turnaround includes separation, multiple instruments, queues and review; individual laboratory tests can still be fast.
Distillation establishes the potential product slate. Physical crude distillation separates material into boiling intervals and measures recovered fractions. ASTM D2892 describes a standardized fractionating-column procedure that also produces cuts for further testing. The cited edition explains the method; laboratories should use their applicable current procedure.
High-temperature gas chromatography offers simulated distillation: retention behavior is related to boiling temperature to estimate the distribution without collecting each fraction. ASTM D7169 covers crude oils and residues, including recovery considerations. Physical distillation, simulated distillation and a spectroscopic prediction are different analytical routes and need explicit comparability checks.
At the atmospheric column, naphtha, kerosene and gas-oil samples reveal whether separation meets downstream needs. Atmospheric residue may enter vacuum distillation, yielding vacuum gas oil and heavier residue. Operators combine fraction properties with temperature, pressure and flow data to assess cut-point changes.
Conversion changes the molecules. FCC, hydrocracking and coking have different feeds and constraints. Feed metals, nitrogen and carbon-residue tendency help assess processing demands. Product analysis tracks the consequences of operating severity. Hydrogen demand cannot be inferred from sulfur alone; aromatic saturation and other reactions also contribute.
Treating and blending require product-specific tests. Sulfur analysis checks desulfurization performance. Gasoline can require octane testing in a standardized engine, volatility measurements and composition checks. Diesel needs ignition-quality, viscosity and cold-flow evaluation. Jet fuel requires its specified flash-point, freezing-point and other quality tests. Flash-point methods detect ignition of vapor under controlled conditions; cooling tests characterize low-temperature behavior. These answer different questions, so one predicted bulk property cannot stand in for the complete release panel.
ASTM’s fuel-testing guidance illustrates the variety of dedicated methods. Rapid estimates can prioritize confirmation and support blend adjustment; release follows the applicable product specification and approved laboratory practice.
Refineries already monitor fouling, corrosion and storage conditions. The gap is often the frequency and depth of characterization available before a change in crude or blend.
Fouling propensity and deposit chemistry. Process monitoring tracks exchanger temperatures, pressure drop and inferred heat-transfer performance. Detailed investigation can require heated-surface experiments, deposit collection and chemical analysis. Such work cannot necessarily be repeated for every blend. The CROF research programme shows why deposition mechanisms and operating conditions need joint treatment. Asphaltene content is one possible input, not a universal fouling index.
Blend compatibility. Mixing two individually stable crudes can change the solvency of the mixture and precipitate asphaltenes. Laboratories can assess instability using solvent-induced separation with optical detection, as in ASTM D7157. Testing multiple ratios across many candidate cargoes expands the experimental workload. Rapid screening can identify which blends deserve confirmation, but compatibility is not guaranteed by averaging component properties.
Tank stratification and mixing. Different receipts can remain incompletely mixed; water and solids may settle, and temperature differences can affect density and circulation. This does not mean every crude spontaneously separates into light and heavy molecular layers. Detecting nonuniformity requires samples at different depths or suitable spatial monitoring. Dakhel and Rahimi’s refinery-tank study compared modeled homogenization with density measurements at three sampling locations. A single outlet fingerprint cannot reconstruct the entire tank.
Other intermittent investigations include detailed crude assays, emulsion-separation studies, wax behavior and corrosion-product analysis. Specialist procedures, sample conditioning and test matrices consume time and resources. Their frequency varies by site; it would be inaccurate to say that refineries never perform them.
Proton NMR responds to hydrogen nuclei in different chemical environments. Chemical shifts and signal patterns provide information about aromatic and aliphatic environments and molecular structure. In crude oil, many compounds overlap, especially at lower magnetic field, so a bulk spectrum is a chemical fingerprint rather than a complete inventory of individually identified molecules.
High-field NMR separates resonances more effectively and supports detailed structural investigations. Benchtop NMR offers a more compact measurement platform. Neither directly measures every refinery property: sulfur, TAN, viscosity and boiling yields can be inferred from spectral correlations only within a validated model’s scope.
There is direct experimental support. A 2020 benchtop NMR study used 60 MHz proton spectra and partial least-squares models on more than 170 crude samples to estimate API gravity, sulfur, TAN and distillation yields. The authors report external validation and predictions within minutes. That result supports the analytical approach for the investigated population; it does not validate every commercial model or unfamiliar feedstock.
For distillation yields, the model learns the relationship between spectral features and reference boiling curves. If the predicted cumulative mass recovery is 20% at one cut temperature and 45% at another, the interval contains an estimated 25 mass%. Those numbers are illustrative. A separate NMR study predicted temperatures at selected distilled-volume fractions and estimated prediction intervals.
Mass and volume bases must remain distinct. Predicted boiling fractions describe feed potential; actual unit yields also depend on cut points, operating conditions and downstream conversion. Faster assay estimates can update a refinery planning model, but they do not replace the process model.
Scientific literature supports the loss mechanisms more strongly than a universal saving per barrel. Ishiyama and colleagues studied fouling management and desalter-temperature control in an industrial preheat-network case. Coletti and Macchietto modeled the energy and economic consequences of fouled heat exchangers. These studies support attention to heat recovery and operating constraints; neither establishes savings from a specific analytical product.
Use site data to quantify three opportunities:
| Opportunity | Calculation | What must be demonstrated |
|---|---|---|
| Fouling management | Avoided fuel + avoided throughput loss + net cleaning savings | Earlier analysis changes a successful operating or maintenance action |
| Tank uniformity | Avoided off-spec/rework cost + avoided feed disruption − extra mixing cost | Profiling detects a meaningful gradient and intervention improves outlet consistency |
| Production allocation | Additional valuable output × incremental net contribution − added operating costs | Better feed information produces a feasible change in cut allocation or routing |
Illustrative yield scenario. Assume 100,000 barrels/day of feed. If better planning actually shifts 0.5 percentage points of volume yield toward a cut worth an additional $15/barrel in net contribution, the effect is 500 × $15 = $7,500/day, or $2.48 million over 330 operating days. This assumes a feasible yield shift and a contribution difference after relevant variable costs. It is a sensitivity calculation, not a measured project result or a claim that analysis alone creates yield.
Illustrative energy scenario. Avoiding 1 MW of additional fired thermal duty for 8,000 hours saves 8,000 MWh of heat. At 90% heater efficiency and an assumed fuel price of $30/MWh, avoided fuel expenditure is approximately $267,000/year. Establish the avoided duty from operating evidence; a spectral warning alone cannot prove it.
For stratification, value fewer feed-quality excursions and unnecessary mixing hours using actual event records. Compare normal operating periods and account for slate, rates and maintenance changes. Avoid adding overlapping benefits twice. Net value must deduct sampling, reference testing, software, equipment, support and intervention costs.
| Approach | Strength | Time and deployment considerations | Main limitation |
|---|---|---|---|
| Laboratory panel | Property-specific reference measurements and physical fractions | Some tests are rapid; comprehensive assays involve many operations | Full characterization may arrive after a short operating decision window |
| NIR | Fast routine screening and established process-analysis applications | Rapid scans; online deployment requires sampling interfaces and maintained calibration | Predictions depend on matrix coverage, temperature and reference data |
| High-field NMR | Detailed molecular-environment information and structural research | Experiment-dependent acquisition plus preparation and interpretation | Specialist operation and infrastructure; property predictions still require validation |
| Rombo AI + benchtop NMR | Rapid fingerprint-based property and yield reporting | Company materials describe approximately 15-minute reports for supported workflows | Property coverage and prediction error must be demonstrated on the intended crude slate |
NIR measures vibrational overtone and combination bands and has credible refinery applications. IFP researchers demonstrated multivariate predictions for middle-distillate properties; Metrohm markets fuel-blending applications. Calling NIR intrinsically unreliable would ignore this evidence. Bruker’s petroleum NMR applications illustrate the structural information available from high-resolution measurements.
Rombo AI combines benchtop spectra with learned representations and property models. Its refinery presentation describes a 60 MHz workflow and approximately 15-minute reports including property estimates and distillation yields. These are company-reported capabilities. Its foundation-model approach, pretrained on millions of spectra, aims to make spectral representations reusable; individual property models still need suitable reference labels and validation.
A useful pilot would profile tank depths and the feed header, compare predictions against reference methods, and test whether operators receive actionable information before the next decision. Require property-specific error, uncertainty and out-of-domain handling. This refinery material-analysis application belongs to the broader Rombo AI platform.
Want to assess faster characterization for your crude slate? Discuss a refinery feasibility study with Rombo AI.
Can rapid NMR detect tank stratification? It can compare samples from different depths and times. It requires a representative sampling plan and cannot infer unsampled layers reliably from one measurement.
Can it predict fouling or corrosion directly? Spectral models may estimate relevant properties or risk proxies. Equipment risk also requires operating history, surface conditions and process measurements; site-specific validation is essential.
Are predicted distillation yields actual production yields? They estimate boiling-range recovery on a specified reference basis. Plant yields additionally depend on operation, separation and conversion.
Does a 15-minute report mean continuous monitoring? No. Sample collection, transport, preparation and review add latency. Continuous or online operation requires an engineered sampling and measurement installation.
Can faster predictions replace the release laboratory? They can support screening and adjustment. Required product-release testing and reference measurements remain governed by the applicable specification and validated workflow.
Posted by
Andrea Zanda — CEO & Co-founder
BOOK A DEMO
Share your analytical challenge with our team. We will assess technical fit, data or sample requirements, and the fastest path to a focused pilot.
Book a demo